

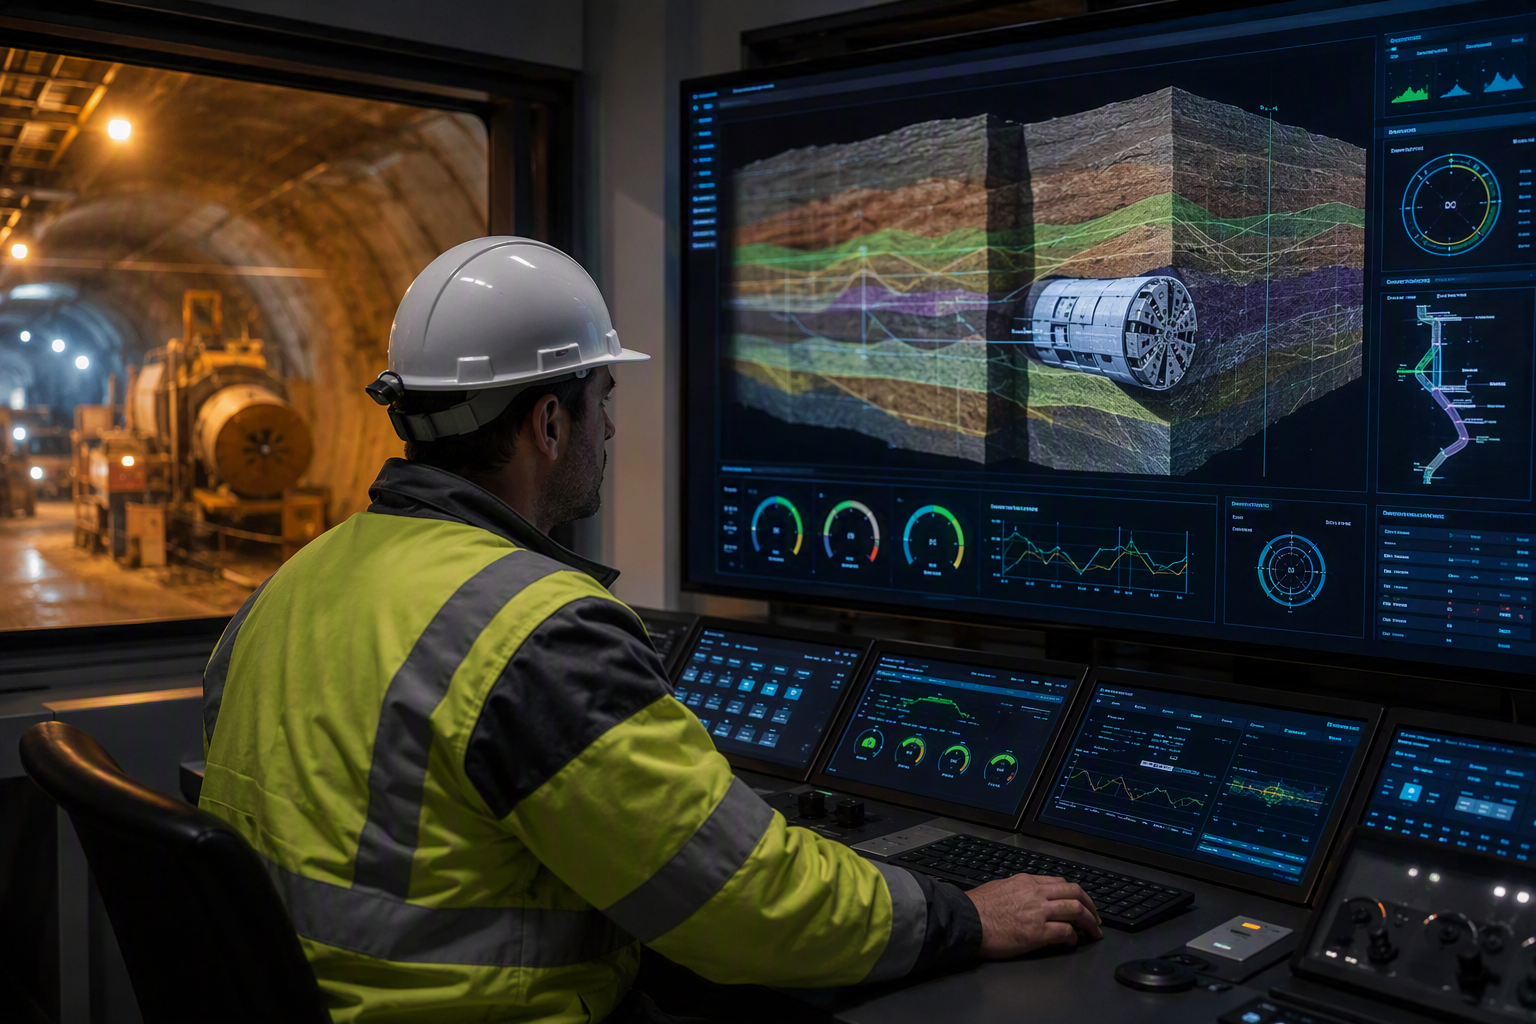
Real-time tunnelling, visualized
Users track machine performance, manage worker shifts, generate detailed reports, and visualize project data on interactive maps and 3D views enriched with geological information, with an integrated document-management system supporting team collaboration through storage, search and sharing. The defining technical challenge is processing and visualizing very large volumes of real-time sensor data, including folding geological data into 3D models — and the work is done in close collaboration with the client's own team, because getting it right depends on deep domain knowledge as much as engineering.
A family of sub-projects
Around the core platform we built a set of sub-projects: a resource-management tool for the tunnelling industry (underground machine navigation, tunnel-ring-segment management, shift scheduling and reporting); a shift-management app for tracking shifts, workers and equipment, with a Gantt view and report generation; a map-tracking view showing machine position, tunnel route and sensors with ground-condition monitoring; a monorepo migration consolidating several independent applications into a shared codebase; and a security-and-monitoring application that visualizes the entire tunnel with the positions of people and equipment and raises alerts on risky signal values.
Technology
Java, AngularJS and Angular with TypeScript, HTML and SCSS/SaSS, RxJS, Angular Material and Leaflet maps in an NX monorepo; .NET with Swagger; Azure, Docker and Kubernetes; Redis, SQLite, Firebird, MongoDB and InfluxDB; and SignalR and Python — with an older part of the engagement built on Groovy, JPA, Hibernate, Spring, MySQL and ModeShape.